From 14 June to 18 June, we had a tough field campaign to achieve three main objectives
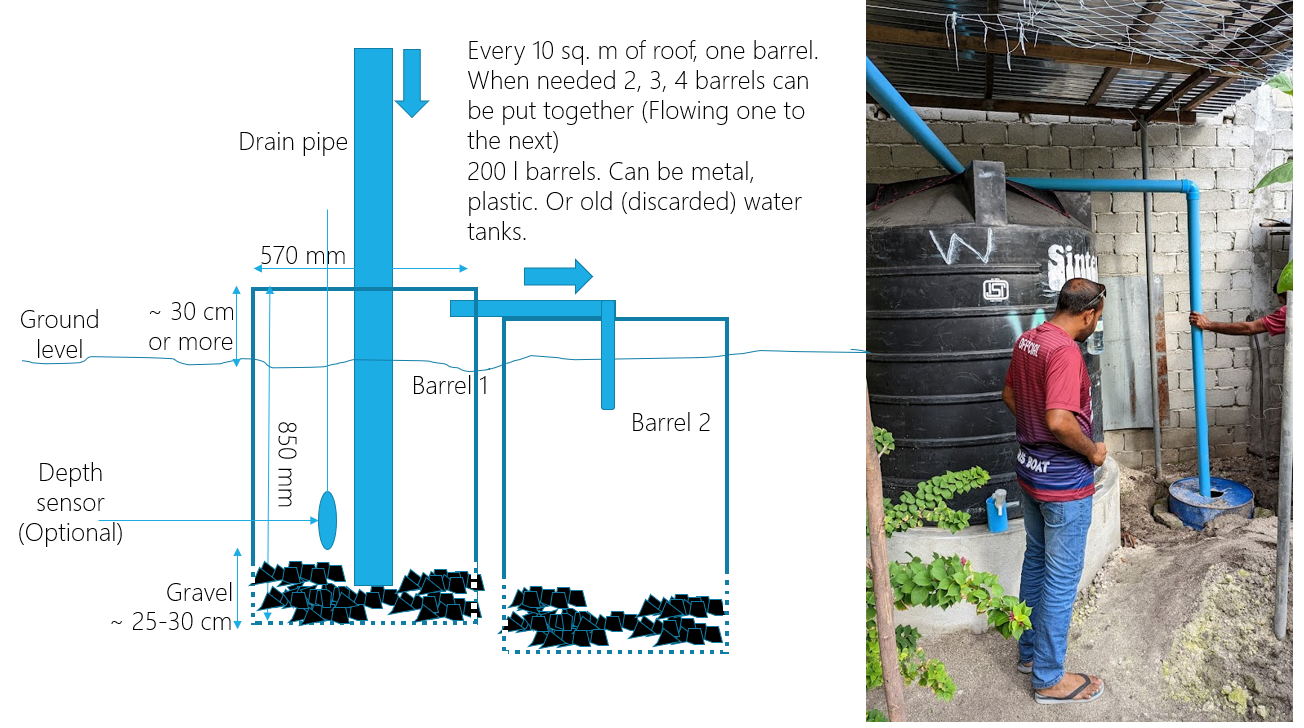
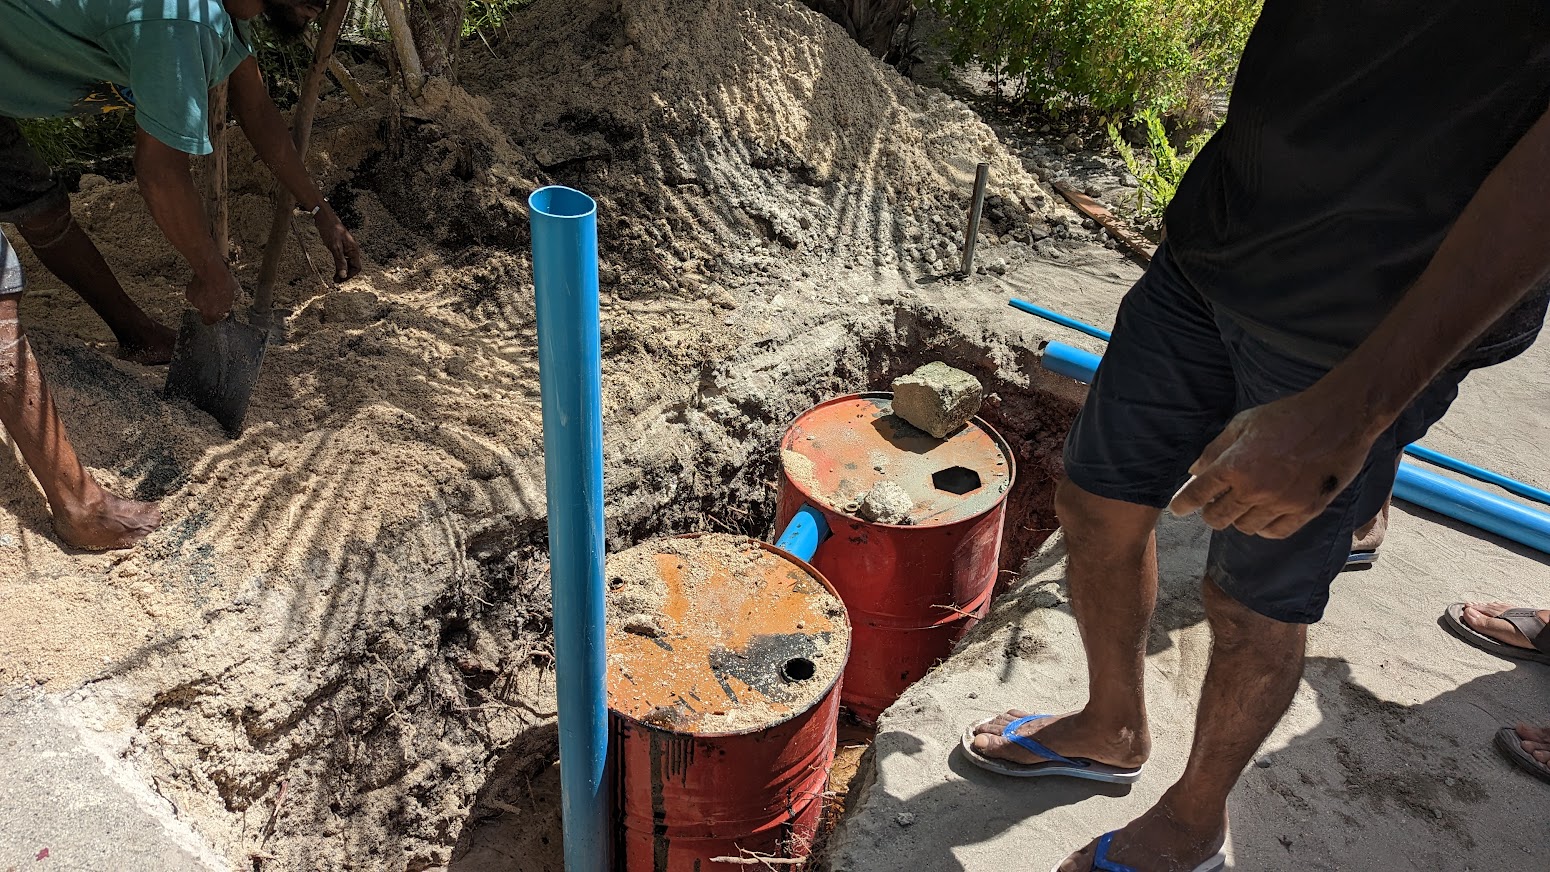
- Installation of pilot infiltration pits
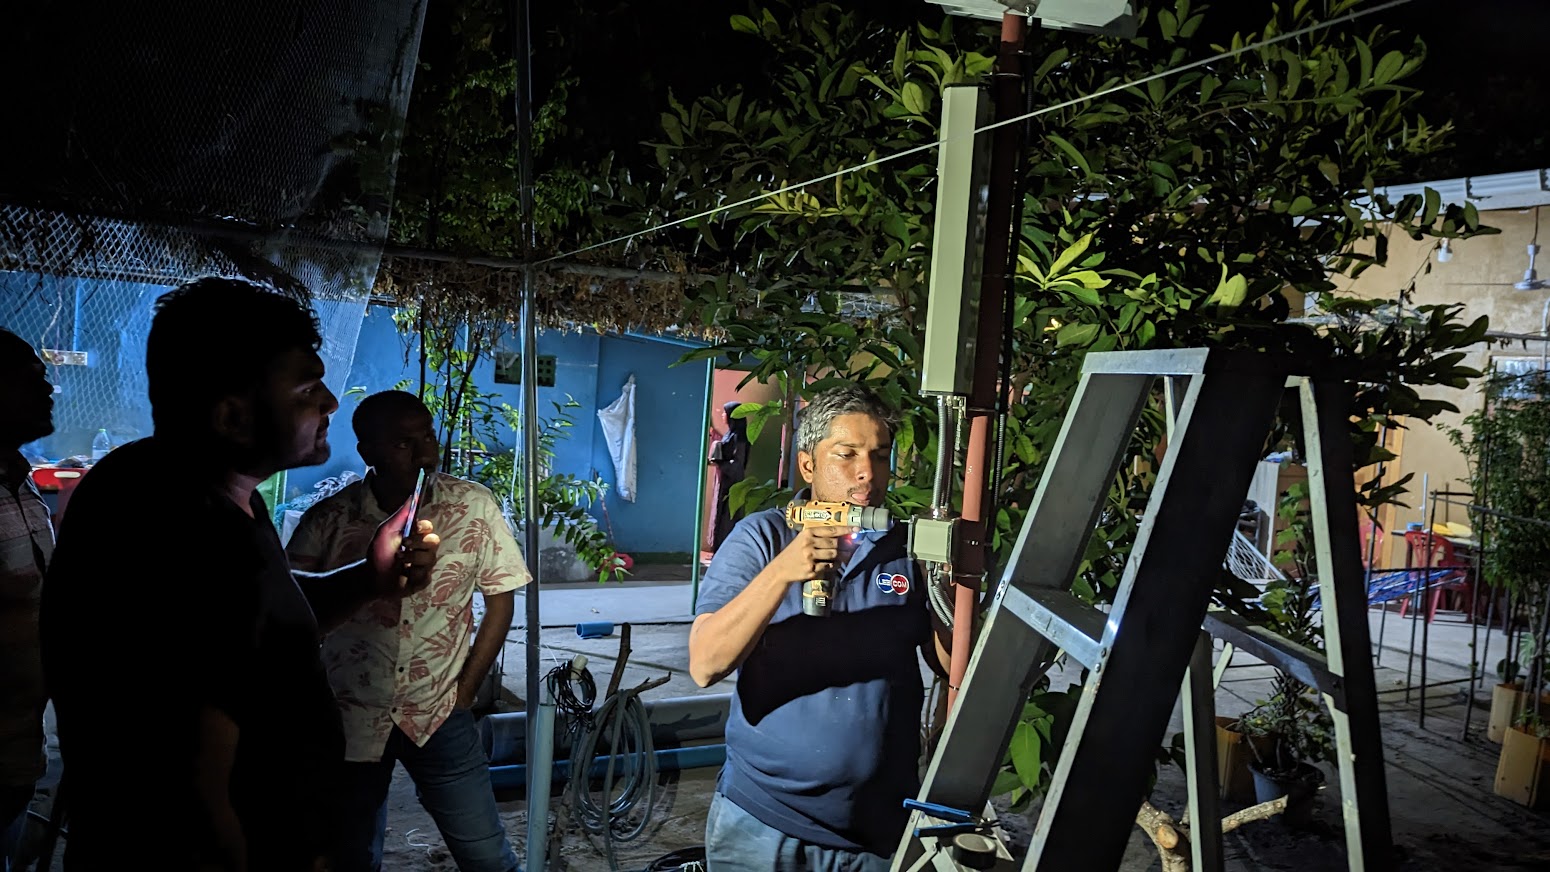
- Setup monitoring stations
- Conducted a precision UAV survey of the project islands
We had to work hard, often until late, but we were able to complete everything according to the plan.
Infiltration pits
Groundwater monitoring stations
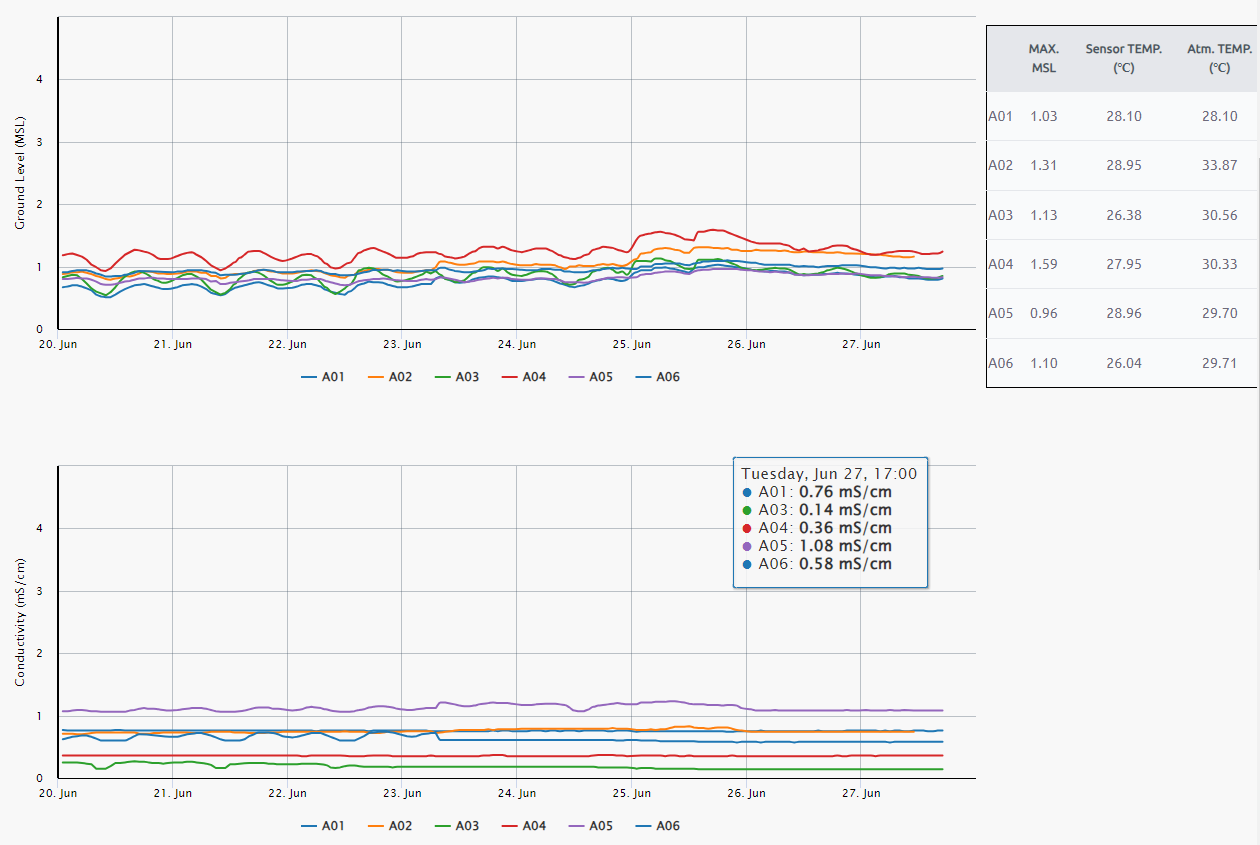
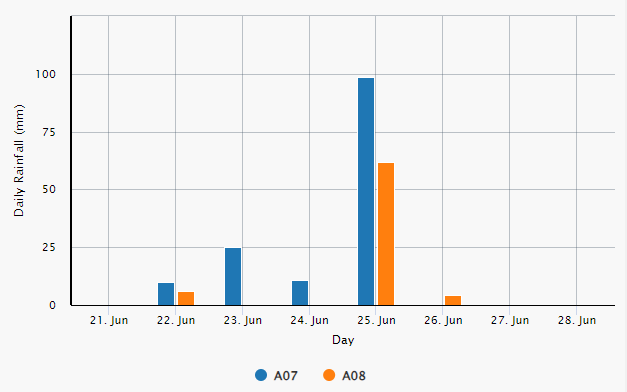
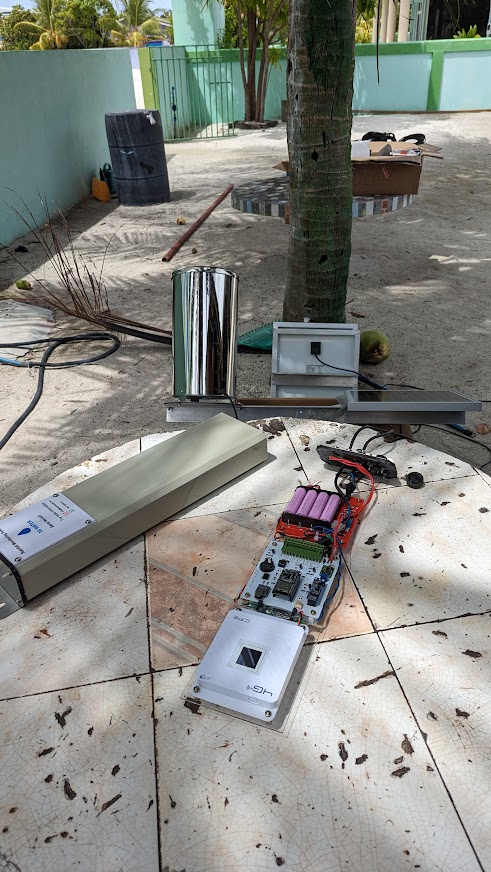
We installed a total of six groundwater monitoring stations which continuously (every 15 minutes) measure the groundwater level and salinity (by measuring the temperature and conductivity of water). Two stations on each island: One to monitor the impact of infiltration pits, the other as a control.
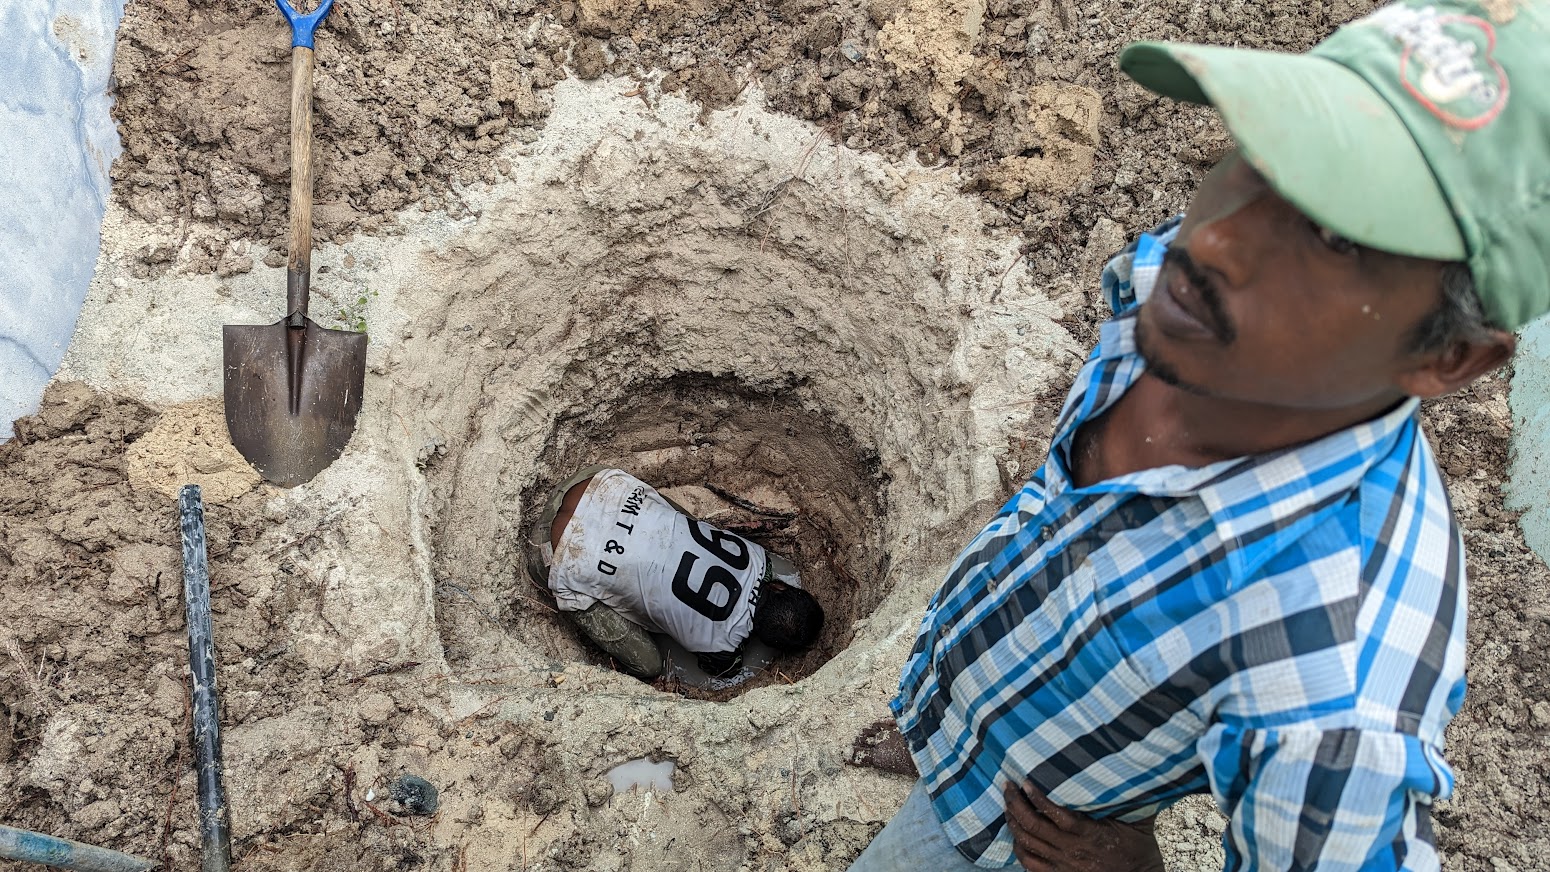
We first used a diesel auger (kindly lent by one of our advisory team members). But due to the nature of the island’s soil (Relatively soft sandy soil down to about 1 m, then a very hard compacted rocky later; finally lose sand at and below the water table.) that did not work very well below water table which occurs at around 1m depth.
We had to decide to try manual digging.
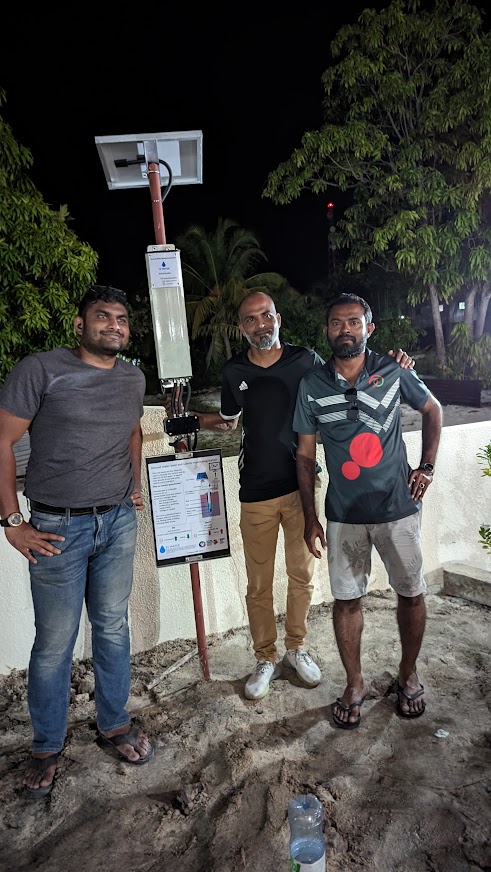
All the monitors are working and are remotely reporting the data to us! At the moment we are busy setting up a nice plotting system to consume the API endpoint that is sent by the monitoring system and to present it on this website. Coming soon … Meanwhile …